The question sounds simple: Is the firm on track? But ask that mid-quarter without a clear reporting framework, and the answer requires pulling time reports, checking invoice queues, doing mental math on staff capacity — and by the time the picture is clear, the window to act has closed. The data was there. The visibility was not.
This is the situation that data-driven firm management is designed to solve — not by wading through a sea of reports, but by leveraging the right ones. The accounting firm KPIs that actually matter for operations cover four areas of firm health — profitability, capacity, team sustainability, and cash flow.
This article covers those four reports in depth: what each one actually measures, how to read the trend, and what action it should trigger. You will also find a maturity roadmap for firms ready to go deeper, a practical weekly review structure, and answers to the most common questions firms have when they start paying close attention to these numbers.
The goal is not a wall of dashboards. It is a small, purposeful set of reports reviewed on a cadence — with a specific action attached to each one. That is what makes a metric a KPI rather than just a number.
What Accounting Firm KPIs Actually Tell You
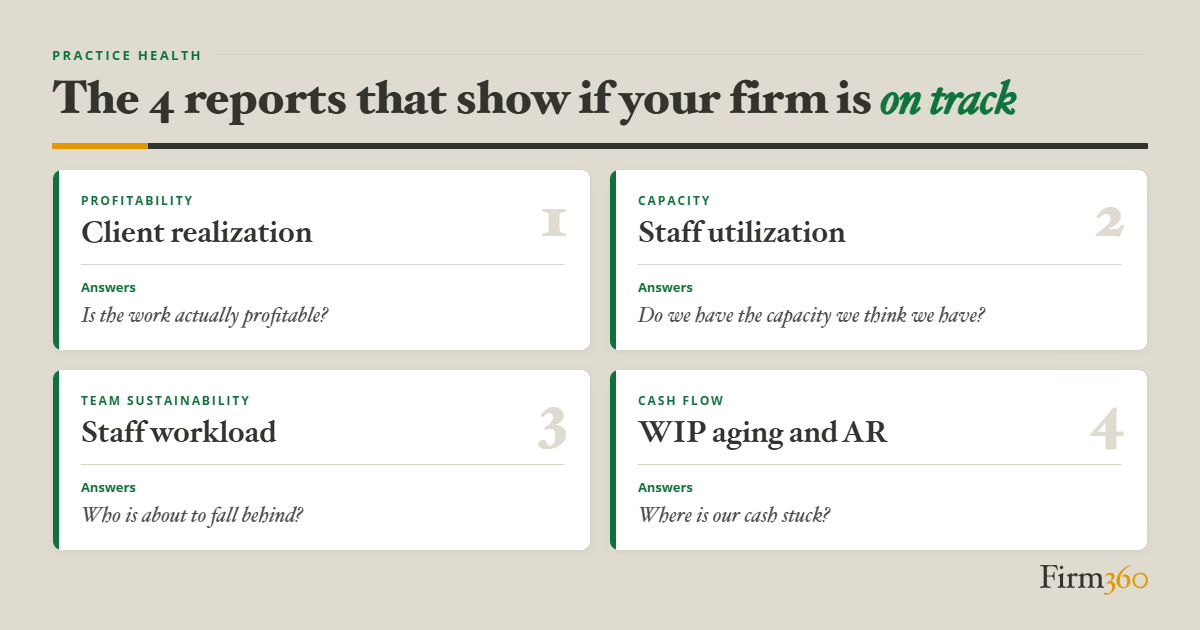
The accounting firm KPIs that matter most for firm health fall into four categories: profitability (client realization), capacity (staff utilization), team sustainability (staff workload), and cash flow (accounts receivable and WIP aging). Together, these CPA firm KPIs tell a partner whether work is profitable, whether staff has sustainable capacity, and whether cash is moving through the firm.
There is an important distinction between a metric and a KPI. A metric is any number you can measure. A KPI — a key performance indicator — is a metric you have committed to act on. If no action is attached to the number, it is just a number. The review should not end with observations; it should end with decisions.
To ground these metrics in real firm practice, we spoke with Joshua Stats, partner at Foresight CPA Group in Salt Lake City, Utah. With more than 20 years of experience — including four years as a Tax Examiner at the IRS — Joshua brings a firsthand view of what it actually takes to manage a firm’s performance week to week.

Here is what these four reports actually cover:
Profitability (realization): Is the work generating the revenue it should? Realization tells you where the firm is quietly writing off revenue — often before anyone realizes it is happening.
Capacity (utilization): Does the firm have the capacity it thinks it has? Staff utilization separates the actual picture from the assumed one.
Team sustainability (workload): Who is at risk of burning out, and who has room to take on more? Workload gives you a real-time view of current assignments — so you can intervene before a deadline slips.
Cash flow (AR and WIP): Where is the firm’s money stuck, and how long has it been there? Aging reports tell you whether the problem is collections or billing discipline — and those require very different responses.
The Core Reports Every Accounting Firm Should Review
Not all of these reports belong on the same review schedule. Most are best checked weekly. Client realization is better suited to a quarterly or off-season review, when there is time and space to act on what it reveals. The cadence is noted within each section.
Client Realization
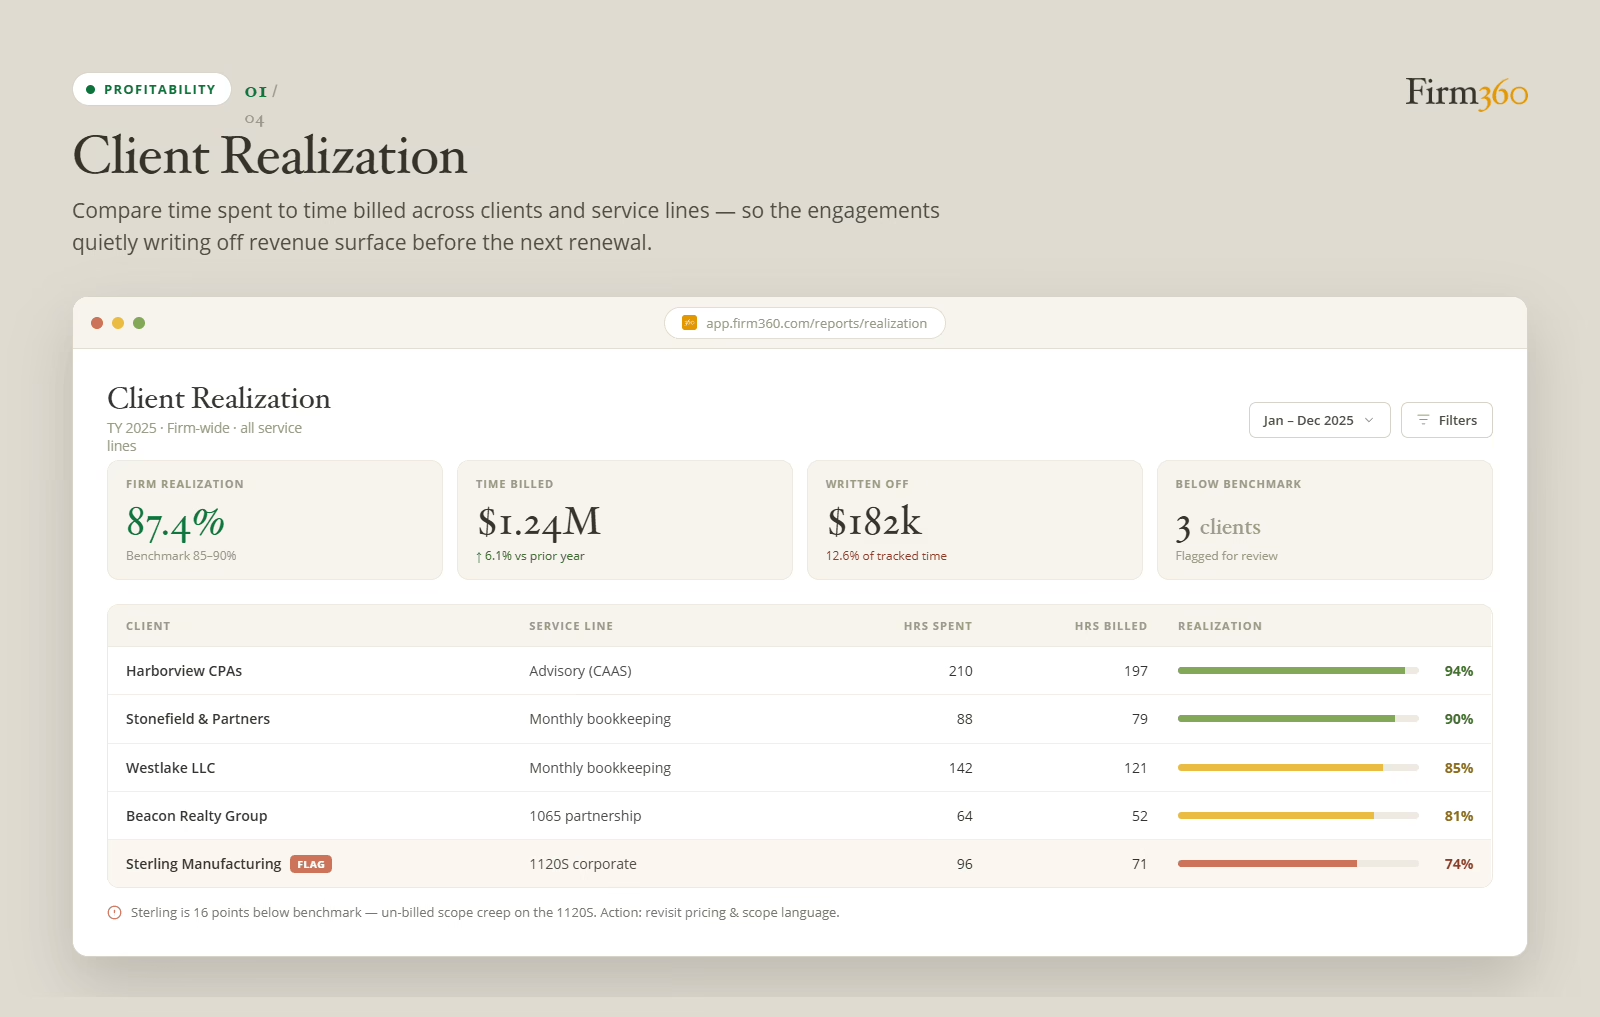
Client realization measures the relationship between time spent on a client and time billed to that client — across individual clients and service lines. A realization rate of 100% means every hour worked was billed and collected at the full rate. In practice, most firms operate below that threshold, and the relevant question is whether the gap is intentional — fixed-fee pricing, relationship considerations — or invisible: scope creep, write-offs that no one flagged, time entries that never made it onto the invoice.
What it tells you: where the firm is writing off revenue it has already earned. The average realization rate varies depending on firm size, but according to the well-known Rosenberg benchmark survey, in recent years firm-wide realization seems to be hovering between 85% and 90%. If your firm’s realization is significantly below that benchmark, it’s time to diagnose the root cause.
Reading the trend: a slow, gradual decline in realization across multiple clients usually points to something systemic — pricing that hasn’t kept pace with scope, time-entry habits that have gotten loose, or write-offs that have quietly become routine. A sharp drop concentrated in one or two engagements typically signals a specific project that went sideways. The distinction matters because the response is different: the first requires a process conversation, the second requires a client or staff conversation. For flat-fee work, watch the hours-tracked trend across successive engagements with the same client — when hours keep rising without a scope or pricing adjustment, each new engagement is less profitable than the last, even if the revenue line looks identical.
When to review it: client realization is best used as a quarterly or off-season analysis rather than a weekly check. During busy season, there is rarely time to act on what the report reveals.
“Typically I use the realization report outside of the busy season to see which clients were most profitable. When realization drops, it might be that not all time is being billed. For flat rate projects, I look at hours tracked.”
— Joshua Stats, Partner at Foresight CPA Group
For flat-fee engagements, the hours-tracked view carries particular weight. Since there is no per-hour billing rate to compare against, the question becomes: how many hours did this engagement consume relative to the revenue it generated? When that number keeps climbing without a scope-adjustment conversation, the problem compounds engagement after engagement.
The action: tighten scope language on the engagements where realization has slipped most, or discuss creating new engagements. Revisit pricing on the bottom performers. And check time-entry habits — sometimes the realization problem is not the billing rate; it is that time is not being captured in the first place. Accurate time tracking is the foundation the realization report runs on. Without it, the report tells an incomplete story.
Staff Utilization
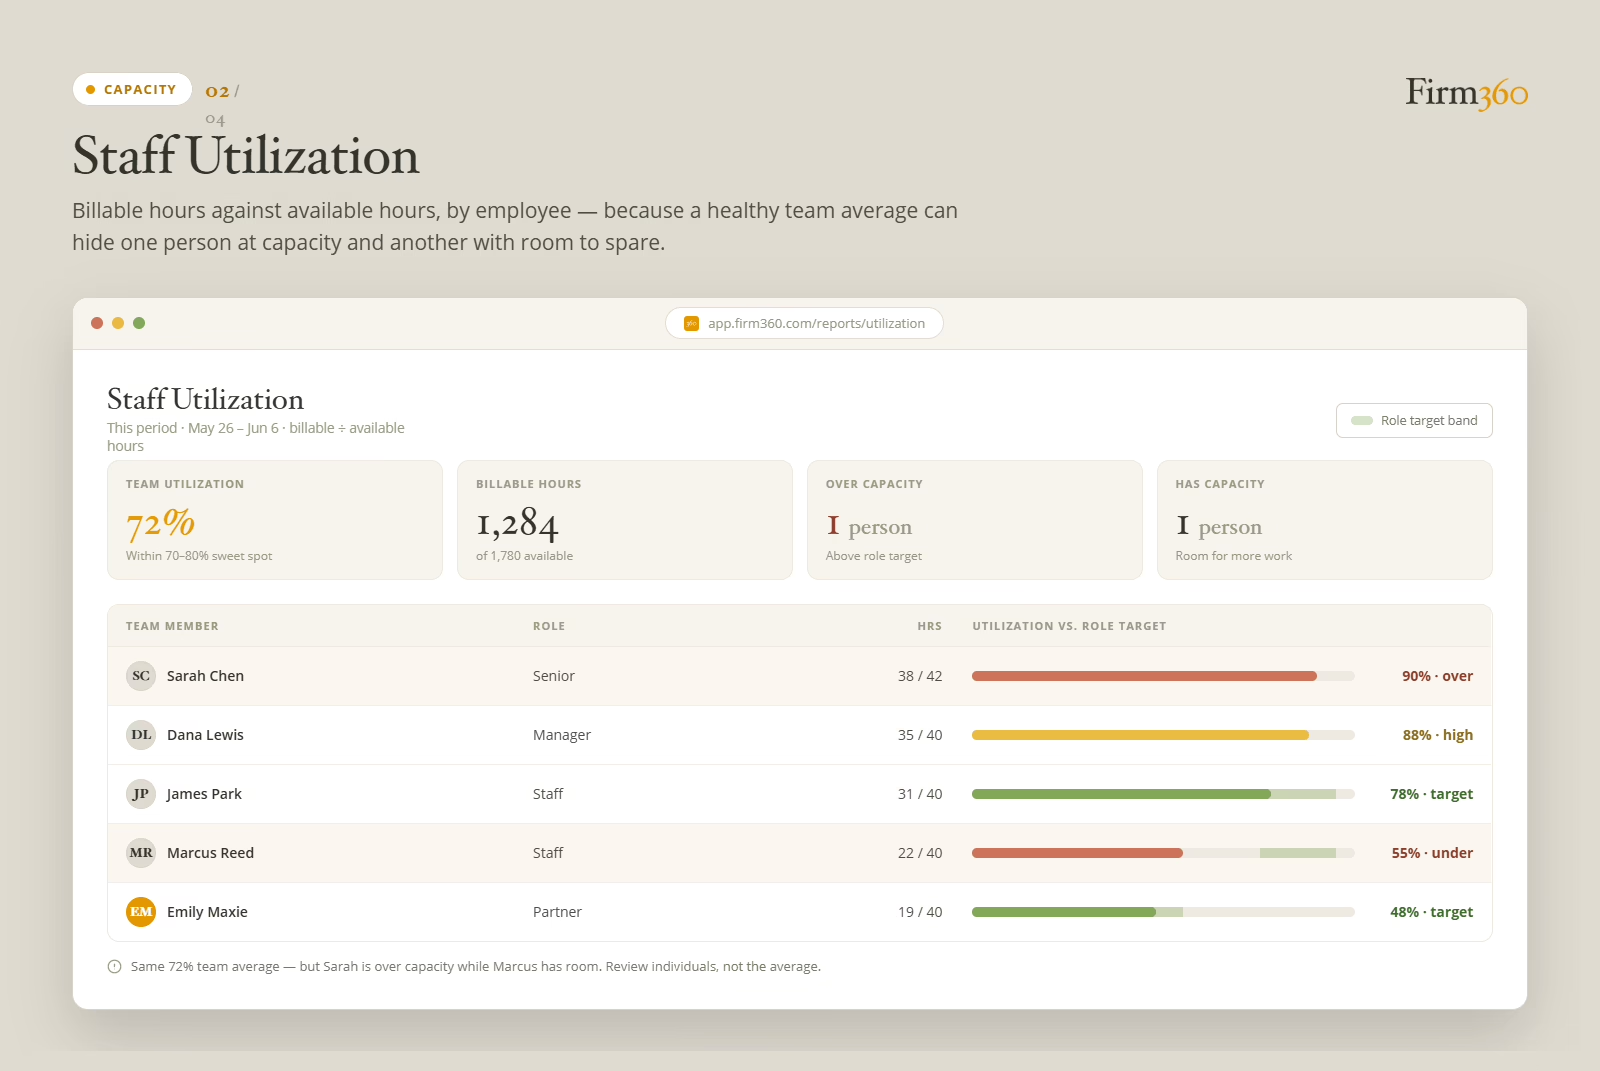
Staff utilization measures the ratio of billable hours to total available hours, by employee or date range. It is the most direct read a firm has on whether it actually has the capacity it thinks it has. According to CPA Practice Advisor, top-performing firms go further — using utilization as a measure of alignment: whether the right people are doing the right work at the right time.
Firms have long used 75% as a working benchmark for the firm overall, but SPI Research’s most recent data, as reported by Workday, puts actual firm-wide utilization closer to 68% — meaning most firms are running below even that historical target. The same research identifies 70% to 80% as the profitability sweet spot.
By role, the picture is more specific: according to CPA firm benchmarks compiled by Madras Accountancy, staff should target 75% to 85%, managers 65% to 75%, and partners 40% to 55% — with the lower partner range reflecting business development and management responsibilities that take time off the production floor.
What it tells you: low utilization typically traces back to one of five causes: seasonal imbalance, poor capacity scheduling, write-downs that quietly remove hours from the picture, senior staff overloaded with non-billable work, or fixed-fee engagements where time tracking has lapsed. Firms moving toward CAAS or advisory work often see the seasonal problem resolve naturally. The rest typically require a process fix.
A utilization rate that climbs too high is its own problem. When staff are consistently overextended, the risks compound quickly — work quality slips, compliance deadlines get tight, and the people carrying the load start looking for the exit. The causes are familiar: a team that hasn’t kept pace with client growth, seasonal volume without a plan to absorb it, inefficient processes that eat billable hours, or a handful of people shouldering more than their share of the technical work.
Reading the trend: a utilization rate that is declining steadily points to one of the low-side causes above — start with write-downs and fixed-fee tracking, since those are the easiest to miss and the fastest to fix. A rate climbing toward or past the upper end of the sweet spot signals a different problem entirely, one where quality, compliance, and retention risks tend to surface before leadership sees them in the data. In either direction, the team average can mislead. A firm-wide rate of 72% can mask one person running at 95% and another at 50% — and those require completely different responses.
“When there are large anomalies with staff utilization, a one-off meeting to discuss with staff makes sense. Otherwise, we address this during performance reviews. Many firms only have performance discussions once a year, but I think twice a year is better.”
— Joshua Stats, Partner at Foresight CPA Group
The action: when utilization is low, identify the root cause before acting — rebalancing assignments, improving the intake process, and tightening time-tracking discipline are different interventions, and the wrong one will not move the number. When it is high, act before the problem shows up in turnover or missed deadlines. And always review at the individual level, not the team average.
Staff Workload
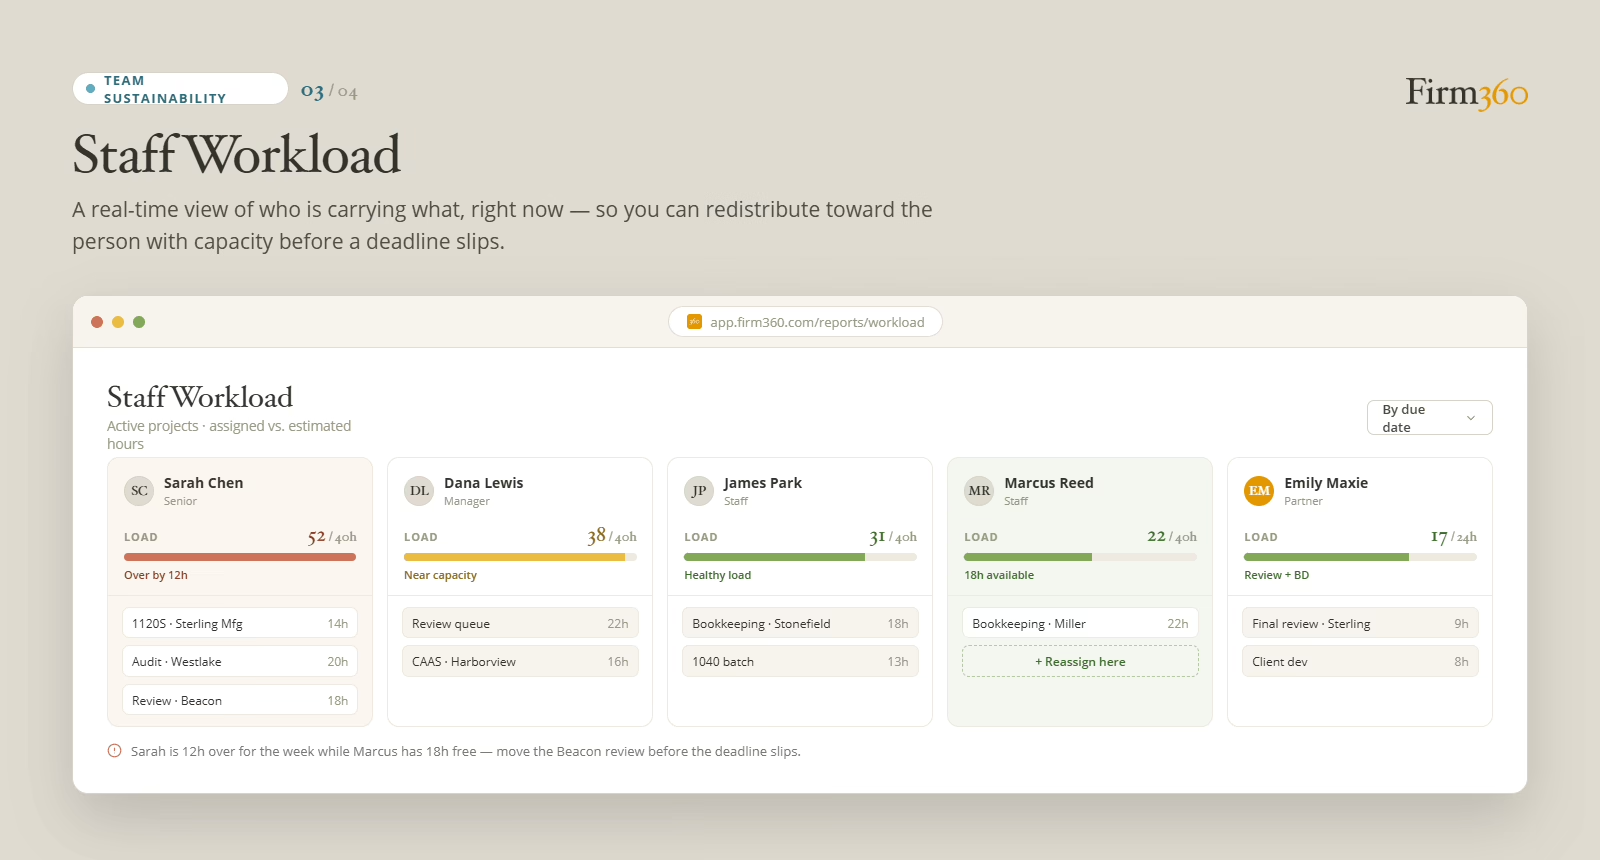
The Staff Workload report shows who is carrying what, right now — a real-time view of currently assigned projects across the team, filterable by client, project status, project template, due date, or deadline date.
While utilization tells you how the team’s hours were allocated over a past period, workload tells you what is on each person’s plate at this moment. One tells you what happened; the other tells you where to act.
That said, what tool you use to get that view matters less than the consistency of the habit:
“For a small to mid-size firm, I’ve found that the easiest way to manage workload is to review the project status report and have conversations regularly with staff. Some platforms offer a workload report. If you’ve entered time estimates, this report can be useful. Without the time estimates, it will be a situation of garbage in, garbage out.”
— Joshua Stats, Partner at Foresight CPA Group
When using the workload report, make sure time estimates have been entered so there will be benchmarks to compare against. You may expect a bookkeeping project for one client to take 30 minutes a month, whereas you might expect a bookkeeping project for another client to take 20 hours a month. Estimated time per project helps you plan capacity.
What it tells you: at a glance, the workload report answers two questions — who has too much, and who has room for more. That sounds simple, but most firms operate without this visibility. Assignments accumulate informally, overload builds gradually, and the first sign that someone is buried is usually a missed deadline rather than a flagged capacity issue. The workload report surfaces that picture before the deadline arrives.
Reading the trend: workload is a current-state view rather than a historical one, but patterns emerge over time. When the same staff members appear overloaded week after week, the issue is structural — not a temporary crunch, but a capacity or assignment problem that redistribution alone will not fix. When overload appears suddenly across the team, look at the intake calendar: a wave of deadlines likely landed at the same time, and the question is whether that was predictable and whether the pipeline can be staggered going forward. If the report looks unusually light during a known busy stretch, check whether all active work has been properly assigned in the system before drawing conclusions.
The action: review workload before deadlines arrive, not after. When someone is overloaded, redistribute toward the team member with capacity. A single over-capacity staff member is a compliance deadline waiting to slip — and protecting that person protects the client. For more on the workflows behind these metrics, the upstream workflow habits that feed the workload report are worth examining separately.
WIP and Accounts Receivable
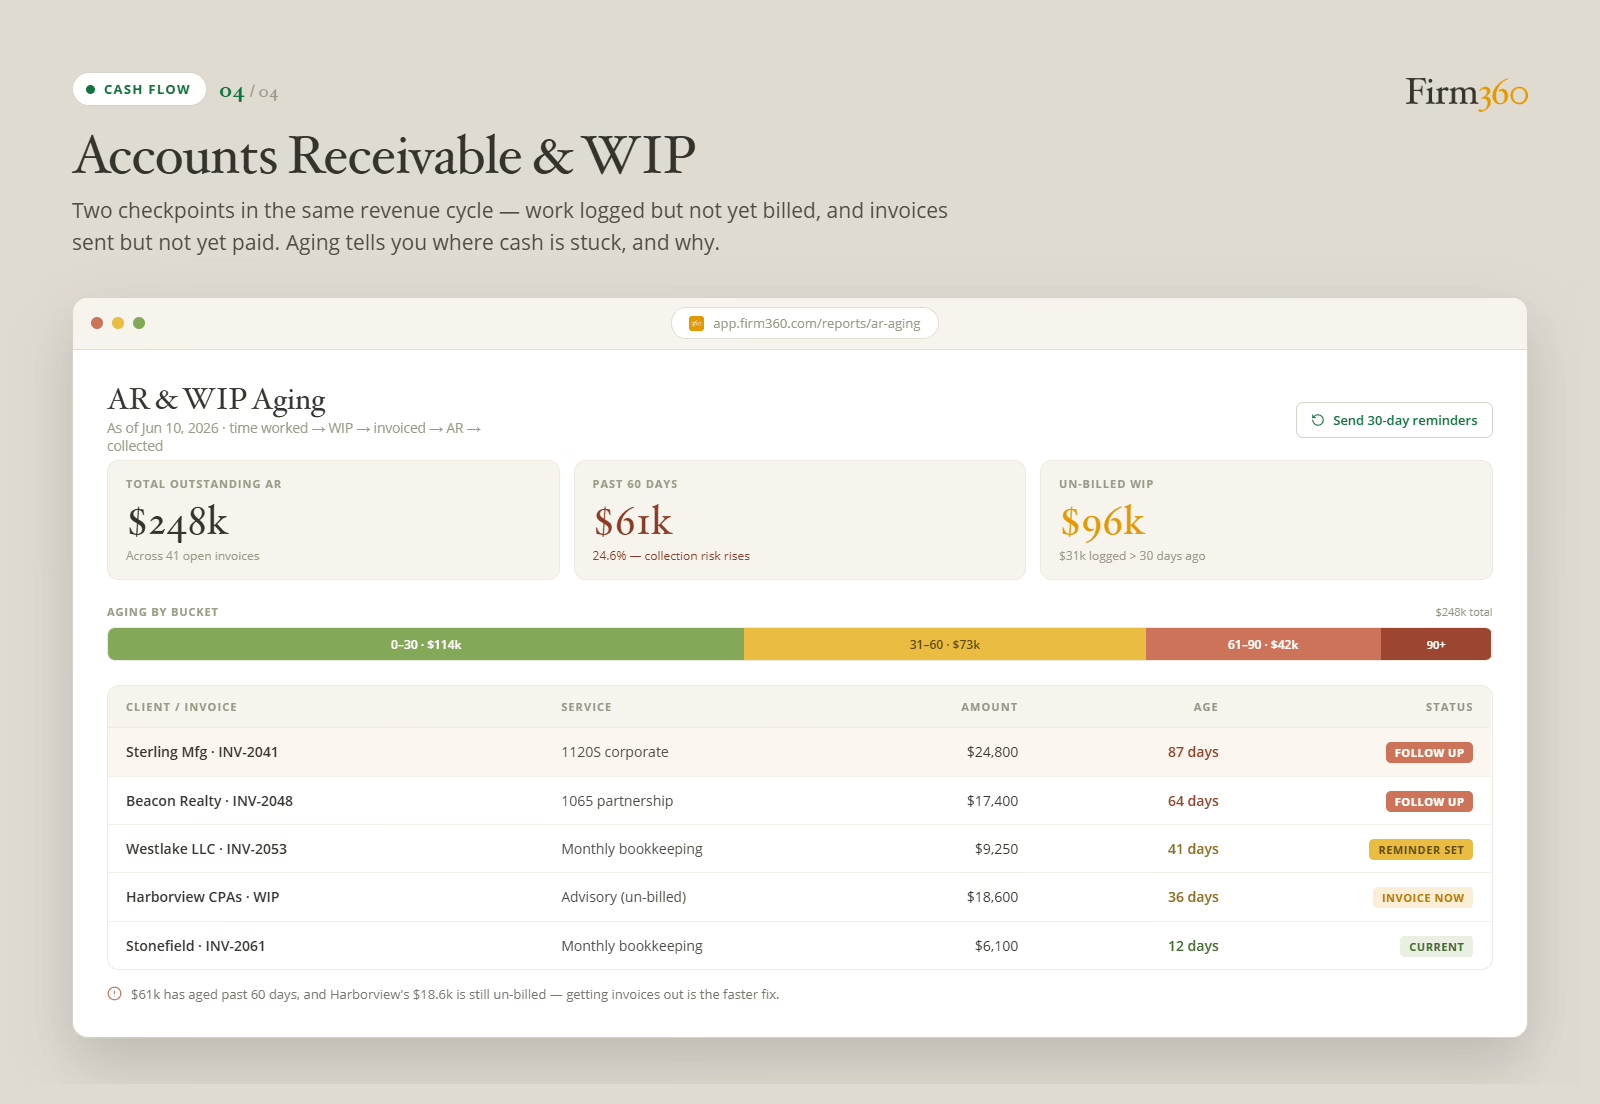
Think about WIP and AR as two checkpoints in the same revenue cycle — and two places where cash quietly gets stuck.
WIP (work in progress) is pre-invoice: time and expenses logged but not yet billed. Every hour a staff member records lives in WIP until the firm invoices it, writes it down, or writes it off. AR (accounts receivable) is post-invoice: what clients owe after the invoice has gone out. Once the firm bills, the amount moves from WIP into AR, where it stays until the client pays or the firm absorbs the loss.
Time worked → WIP → invoice sent → AR → cash collected. A firm with healthy cash flow keeps that cycle moving. A firm with cash flow problems usually has a leak at one stage or the other, sometimes both.
What it tells you: WIP and AR aging reports reveal where revenue is stuck and why — and they point to different problems. Growing WIP means billing has fallen behind: work is being done but invoices are not going out, or there is scope the firm is reluctant to put on an invoice. Aging AR means clients are not paying, invoices are disputed, or follow-up has slipped. A firm can look productive and profitable on paper while quietly carrying a cash flow problem in one or both reports.
Reading the trend: WIP that builds steadily month over month signals a billing cadence problem. WIP concentrated in older buckets is more pointed — work was completed weeks ago and still has not been invoiced, which usually means a write-down conversation no one wants to have. On the AR side, watch for invoices migrating past 60 days. That is where collection probability drops meaningfully and a follow-up call becomes non-optional.
“Each partner sees WIP as they bill. Occasionally, if there’s an unusually large amount of WIP we’ll have meetings to discuss what’s happening and why, although I’m not as concerned about AR as long as invoices are going out.”
— Joshua Stats, Partner at Foresight CPA Group
The implication is practical: getting invoices out promptly is the more critical behavior. When invoices go out on time, AR largely takes care of itself. When invoices are not going out, the aging report is masking a more fundamental workflow problem.
The action: trigger follow-ups on the oldest receivables, set recurring reminders for balances over 30 days, and address any billing lag between completed work and the invoice going out. The billing data these reports run on needs to be current for the aging report to be useful.
For more on choosing a platform that surfaces these core KPIs, the broader practice management picture is worth exploring.
How to Put These Metrics to Work
Start with the right set. For most firms, the four reports covered in this article are the right starting point. Beginning with twelve means none of them will receive the attention they need. Start with fewer, review them consistently, and expand only when the habit is solid.
Assign an owner and a cadence to each metric. A number nobody owns is a number nobody acts on. The utilization report belongs to someone. The AR aging belongs to someone. When the number moves, that person is responsible for understanding why — and bringing a recommendation, not just the data, to the next review.
Attach an action to each metric before the next review. The question at the close of every KPI review is not “What did we see?” but “What are we going to do about it, and who is doing it by when?” Reviews that end with observations are reporting. Reviews that end with decisions are management.
The framework only works if the software behind it surfaces the right numbers without requiring manual assembly. For a useful look at matching the right tools to your firm’s size, the platform question is worth examining alongside the process one.

A Simple Accounting Firm KPI Review Rhythm
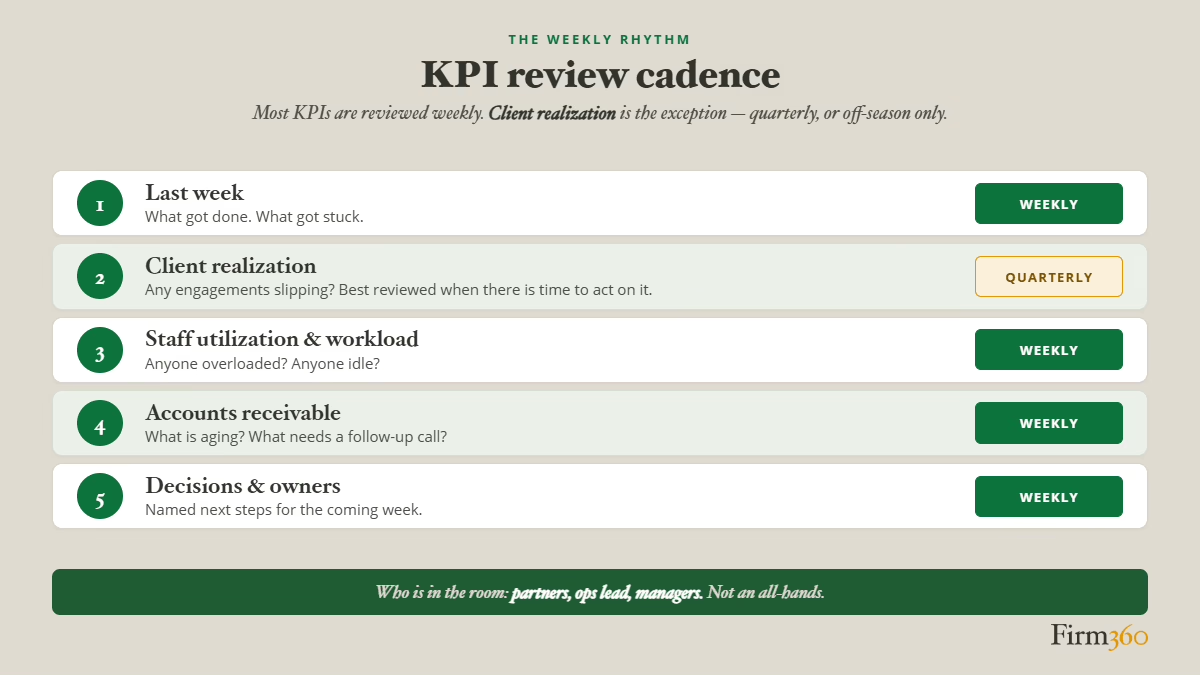
A weekly KPI review does not need to be a long meeting. For most firms, 15 to 30 minutes is enough — if the right people are in the room and the structure is clear going in.
What to look at, and in what order: start with staff workload and utilization to understand whether the team has the capacity for what is coming this week. Review AR aging for any accounts that have moved into an older bucket and need a follow-up action. Reserve realization for a dedicated quarterly or off-season review — it requires more context to interpret well and more time to act on thoughtfully.
Who should be in the room: the weekly KPI review is a partner and operations conversation. It is not an all-hands meeting. For smaller firms, that may mean one partner and an office manager or firm administrator. For larger firms, it may involve department leads. What it should not include is everyone reviewing numbers that are only actionable by a small subset of people.
The discipline that makes it work: every review ends with named owners and specific next steps. Not “We should look into the AR situation,” but “Sarah will follow up with the three clients over 60 days by Thursday.” The value of the meeting is directly proportional to the specificity of the decisions that come out of it. Without that discipline, even the best-designed KPI set becomes just another report.
FAQs
What KPIs should an accounting firm track?
The four accounting firm KPIs that matter most for operational health are client realization (are engagements profitable?), staff utilization (does the firm have the capacity it thinks it has?), staff workload (who is at risk of falling behind?), and accounts receivable and WIP aging (where is cash stuck?). Most firms should master these four before adding more. Once review habits are established and each metric has a named owner, firms can grow into additional metrics like on-time delivery rate, billing lag, and rework rate.
What is realization in an accounting firm, and what is a good realization rate?
Realization measures the ratio of time billed to time spent, across clients and service lines. A rate of 100% means every hour worked was billed and collected at the full rate. According to the Rosenberg benchmark survey, firm-wide realization has been hovering between 85% and 90% — a useful reference point, though the right target varies by firm size and service mix.
What is the difference between staff utilization and staff workload?
Utilization is backward-looking: it measures what percentage of available hours were spent on billable work over a past period. Workload is a current-state view: it shows who is carrying what right now — who is overloaded and who has capacity for new assignments. One tells you how the team performed; the other tells you what to do this week. Both matter, but they answer different questions and drive different decisions.
What is a WIP aging report?
A work-in-progress (WIP) aging report shows how much work has been completed but not yet invoiced, and how long it has been sitting un-billed. Paired with an accounts receivable aging report — which tracks invoices that have been sent but not yet paid — it gives a complete picture of where revenue is stuck in the pipeline. The two reports together are more useful than either one alone, because they distinguish between a billing-discipline problem and a collections problem.
How often should partners review firm KPIs?
Most of the core operational metrics — staff workload, staff utilization, and AR aging — are best reviewed weekly, in a focused 15- to 30-minute partner or operations check-in. Client realization is better suited to a quarterly or off-season review, when there is time to analyze which clients and engagements were most profitable and to act on that analysis.
How do accounting firms measure profitability?
The primary profitability metric for accounting firm operations is the realization rate — the ratio of time billed to time spent. For individual engagements, firms also compare budgeted hours to actual hours tracked. At the firm level, realization across service lines reveals which offerings carry real margin and which are quietly subsidized by more profitable work. For flat-fee engagements, profitability is measured by tracking hours against the fixed fee. Firm360’s Advanced Reporting surfaces realization by client and service line in one place, alongside the other core operational metrics.
Do I need special software to track accounting firm KPIs, or can I use spreadsheets?
Spreadsheets can handle basic KPI tracking, but they have real limits: they depend on manual data entry, they do not update in real time, and they require someone to build and maintain the formulas. For firms managing more than a handful of staff and clients, that maintenance burden quickly outweighs the flexibility. Practice management software built for accounting firms surfaces these numbers automatically, tied to the actual time, billing, and project data. The practice management overview covers what to look for when matching the right tools to your firm’s size.
Firm Health Is Knowable
The firms that manage well are not managing more metrics than the firms that struggle. They are managing fewer, better.
Client realization tells you whether the work is profitable. Staff utilization tells you whether you have the capacity you think you have. Staff workload tells you where work is about to fall behind. Accounts receivable and WIP aging tell you where cash is stuck. Together, these four accounting firm metrics to track give a partner the early-warning system needed to stay ahead of problems rather than respond to them.
If you are ready to see what this looks like in practice, Firm360’s Advanced Reporting brings these reports together in one place, built for accounting firm operations. For a broader view of the platform behind the reporting, explore the practice management overview.
Expert Bio
Joshua Stats is a partner at Foresight CPA Group in Salt Lake City, Utah. With more than 20 years of experience — including four years as a Tax Examiner at the IRS — Joshua brings a uniquely informed perspective to tax preparation and compliance. His experience managing numerous staff and working with several different practice management platforms gives him a practical, firsthand view of what it takes to run an efficient CPA firm.